Netscaler is a complex device, and lets face it a lot of things can go wrong. Either when setting it up or someone does something weird with the config and saves it. So therefore I wrote this basic troubleshooting guide, hopefully it will be some help for some ![]()
This guide is primarily written with CLI in mind, of course the appliance includes a pretty comprehensive GUI diagnostic menu as well. 
Here you also have the “Call Home” option which (you have to enable the feature first enable feature ch)
Call Home requires that your Citrix NetScaler MPX appliance When the problem cannot be resolved using the old methods, you can decide to push “Call Home” which will then upload all the data for troubleshooting to Citrix Tech Support (https://taas.citrix.com) and optionally create a support case. Off course you must have an active Technical Support Contract to make use of this feature. Not having an active Technical Support will result in a registration failure.
Another useful tool is the “Revision history” that allows you to rollback to a previous config file, in case someone made a mistake to the config.
But! Lets first start talking about troubleshooting the network. If you have some traffic issues that you want to debug closer we can start a nstrace.sh or a nstcpdump.sh (for more low level debugging)
both of these store in cap (capture files) that you can analyze further via for instance Network Analyzer or Wireshark, and ill show you how.
If I run for instance the command nstrace –time 30
I will store trace data for 30 seconds in each a new cap file.
I could also for instance apply a filter to the trace in order to “filter out” stuff that I don’t need.
I could use –filter “SOURCEIP == 10.0.0.1” –time 30
This would fetch out traffic where the source IP is from 10.0.0.1
There are some other filters that you can use, they are listed here –>
http://support.citrix.com/article/CTX120941
In order to kill a trace push CTRL + C
Now if you want to fetch out these files you need a SCP client for instance WINSCP
After you have downloaded and installed the client you can establish an connection to the NSIP.
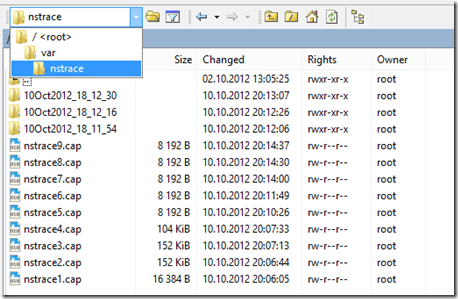
Now if you go to the root/var/nstrace catalog and copy over some of the cap files. And I suggest that you open these in for instance Wireshark.
IF you open Wireshark and choose the import file option and choose one of the cap files
Here is the cap file where I put the filter on Source ip. If you can perform a raw dump on the netscaler ( This is pretty CPU intensive so be careful ) and then perform analysis in Wireshark.
Now that we’ve covered the networking part, we can move forward to moving event viewers.
If you connected to the netscaler console you can run the command nsconmsg you have to run the command shell first.
And after you start it the console might get spammed.
You can also open log files from –> /root/var/nslogs (and there are some useful logs there)
Httperror.log
cron
Dr_error.log
Httpaccess.log
License.log
Nscollect.log
Nsvpn.log
Nsvpnd.log
Snmpd.log
and you can use the same command to view archived logs. For instance if you have a newnslog.100 file.
cd /var/nslog
tar xvfz newnslog.100.tar.gz
/netscaler/nsconmsg -K /var/nslog/newnslog
(Remember to use K not k in the command a small k is used to write logs not read)
This will read archived logs.
You can also use the common unix command top to view utilization.
Also you can use the command ns commands:
Stat ns
Stat cpu
Stat interface
Common stat commands for vserver and service:
Stat lb vserver
Stat cs vserver
Stat service
Other common stat commands:
Stat dns
Stat ssl
Stat http
Also when In doubt doublecheck all the settings for a service. For instance if you have a high-availability setup use the
show node
There is also numerous show commands that you can use to check the status of each service.
show node
show info
show license
show lb vserver
show cs vserver
show service
show persistencesession
show connectiontable
show route
show ip
show dns addrec -type proxy
Another useful command is when you are looking at the config file.
sh run | grep XA
this will show the running config but just the lines containing anything with XA
Hopefully this will get you along the way when troubleshooting a Netscaler device ![]()
Would also recommend that you check this URL below for reference for logs and messages.
Other useful links: logs message reference
http://support.citrix.com/article/CTX132382


