So how well does your application perform? This is the question that everyone want to know the answer to, its kinda like the meaning of life (from an IT-pro perspective)
In order to understand how an application performs we can of course look at the memory and cpu usage, but the question that remains uanswered in most cases is, WTF is it doing with the storage system? Enter PernixData Architect
Now I have previously written about PernixData and FVP https://msandbu.wordpress.com/2015/03/20/pernixdata-fvp-what-does-it-actually-do/ Architect uses the same agent on the ESX host, but instead of doing acceleration it does data analysis.
Now many companies that do data acceleration or sell storage often tell you how much IOPS it can do with a specific block type. Now using Architect we can actually see what kind of block sizes our virtual machines are generating and latency / troughput.
The installation process is pretty much the same as FVP we installed the host extension, install the management server which runs on SQL server.
(NOTE: I have a pretty small lab at the moment, running nested ESXi on Vmware workstation) so I only have a few virtual machines
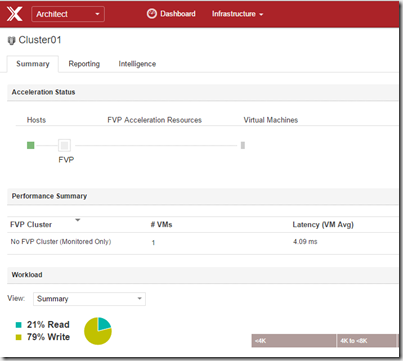
Have to say that the UI is quite an improvement
We can use Architect and FVP within the same UI (Just switch between the dashboard menu in the top) We can do drilldown into different metrics
Which allows us to see latency/iops and what kind of workloads that are running. We can also see the block size breakdown which average IOPS
Now eventually when this is integrated with the Cloud solution that PernixData is building, it will give awesome insight into how we can configure our storage properly and what we can expect of our storage system. And we can eventually get some knowledge on how to properly configure applications and how they operate on a storage level.


