So after getting constantly bombarded with a sponsored tweet on my timelime for a while, I decided to take a hint and take a closer look at what DataDog actually was. So this post is actually just a small introduction to it.
Now DataDog is a cloud based monitoring tool, so you can take it for a test drive for 15 days at datadoghq.com
To my suprise they did quite a bit! I got an email from one of their sales guys pretty fast which notified me that they had pretty good support for monitoring Azure enviroments, so I decided to take a closer look at how it could monitor my Azure enviroment.
Now for Azure they had two options to do monitoring, which was either leveraging an Azure AD user account which has read only access to the all the resources and resource groups, or it was using guest extensions on Windows VMs or Linux VMs. Of course I did a combination of both, which allows me to get the complete overview of VM guest metrics and host maps with the information from Azure.
Just some of the integrations that are possible in DataDog
You can also notice that DataDog is an option when you deploy virtual machines since it a default extension for Linux and Windows virtual machines, do add the agent using JSON templates, is pretty simple since you just need api_key in the template to authenticate the agent against DataDog
{
“publisher”: “Datadog.Agent”,
“type”: “DatadogWindowsAgent”,
“typeHandlerVersion”: “0.5”,
“settings”: {
“api_key” : “API Key from https://app.datadoghq.com/account/settings#api”
}
}
So now by getting information from the Azure subscription it can generate host maps based upon geographic location automatically, it can also monitor other Azure resources like SQL and App Services like Web Services, Logic Apps and so on.
So from the dashboard I can for instance go into a virtual machine directly and see that stats, it will automatically detection the region, resource group which is contained it and add tags to it, which can be used to filter afterwards
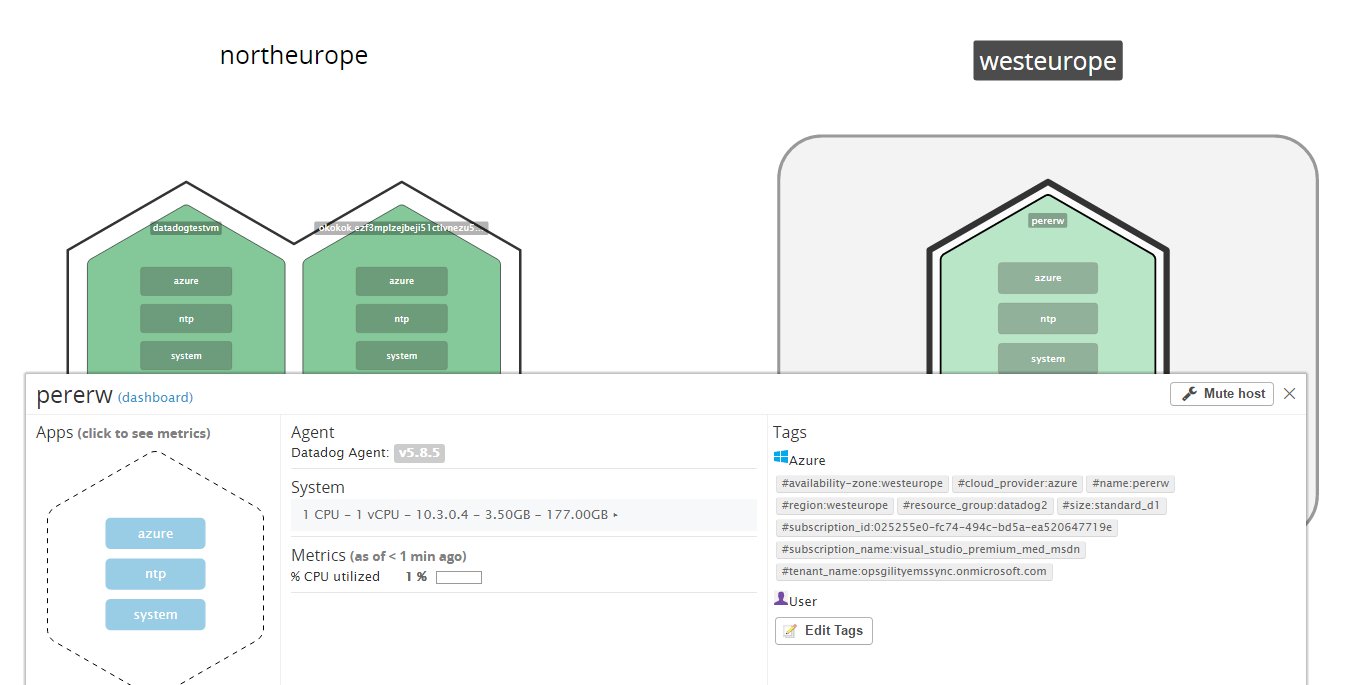
It also gave me a nice host view map, where resources was displayed within their own region they were located in

I could also go into a more detailed view of a host and get more specific metric of a virtual machine directly. Note that datadog uses something called integration packs, which can be enabled for different purposes. For instance there is an own integration pack for Event Log tracking and one for IIS for instance, there is also monitors for WMI and Windows Services. After enabling the integration in the console I would need to modify the agent settings on each agent as well, this could easily be done using DSC for instance to update the agent config.
It was also pretty simple to add specific monitor to detect for instnace 404 error codes on my Web Service running as a service within Azure
So this is just from my initial testing, but I found the product pretty slick! and the UI is great! and with a large list of supported integrations like VMware, AWS, Docker, Apache, OpenStack etc Im definitely going to take even a closer look at this with more workloads. But still its a cloud service monitoring tool and therefore the pricing might be a bit of for larger organizations depending on what kind of pricing they offer.


