I was reached out to a while back and was asked if Splunk and NetScaler worked together? To be honest I haven’t tried that combination yet. So last night we decided to give it a try, using our regular Splunk setup.
Now in order to setup Splunk with NetScaler we need an IPFIX collector setup on the Splunk server, and this is possible using this Splunk addon for IPFX which can be found here –> https://splunkbase.splunk.com/app/1801/
This allows us to gather data using IPFIX into Spunk. And for those that are not aware, Citrix Appflow is basically just an IPFIX protocol which is raw binary-encoded data. In order for the IPFIX collector to be able to intertept this data the IPFIX sender needs to send across the templates to the collector. So when we first setup Splunk and NetScaler we will notice that data is not immediately interpret because it does not have the templates available and data will be listed as
TimeStamp=”2014-07-16T21:00:04″; Template=”264″; Observer=”1″; Address=”10.2.41.254″; Port=”2203″; ParseError=”Template not known (yet).”;
We can specify on the Appflow settings of the NetScaler how often it should send across the templates settings and we can also specify which settings we want in the AppFlow data that is exported to the collector
which is by default set to 10 minutes (I’ve changed it down to 1 minute) but no worry you do not have to change the defautl value, just want because Splunk will buffer the templates, after this we are good to go. Now if we are used to using Citrix Insight for instance it will only get information which is related to ICA sessions or web session, the IPFIX flow from NetScaler actually delivers alot of more useful information.
First add Splunk as an AppFlow Collector
Configure an AppFlow Action which is bound to the collector
Lastly define a Policy which defines which action to trigger if the NetScaler should generate IPFIX flow for a session.
We can use the general expression true which will in essence generate IPFIX traffic for everything… Load balancing, AppFirewall, Syslog, ICA sessions and so on. If we want to filter what we want NetScaler to send to the collector we can use general HTTP expressions like URL, User-Agents like we typically use for session policies to filter out based upon Citrix ICA session for instance.
NOTE: After we have created the policy we have to bind it to a gateway virtual server or globally.
After that is done we have to do the Splunk part. Log into the splunk console and go into the apps menu and choose Install Apps from file. From there point to the IPFIX file which can be found in the link I listed earlier.
When that is configured you should notice that there is an IPFIX data input. By going into Settings –-> Data Inputs
If there isn’t a number that just click Add New and enter the default settings and give it a name. Now when you see that AppFlow records are generated on NetScaler (Which can be easily seen by using the command
Stat Appflow
They should also be appearing in Splunk. Go back to the main menu and choose the Search and reporting option
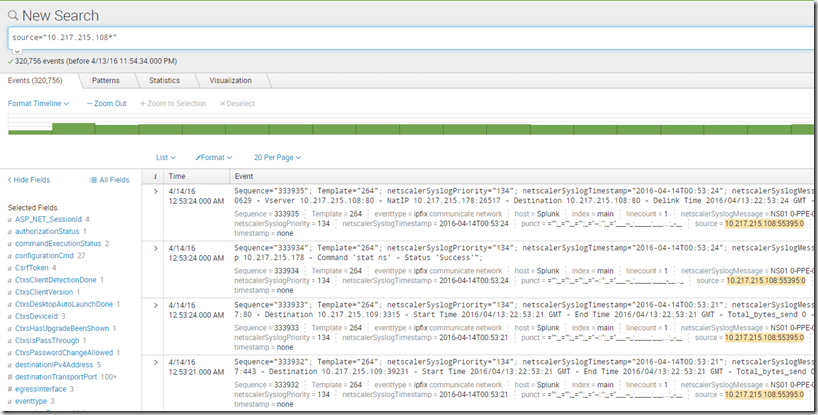
In the search option there we can just use the search prefix source=”NSIPOFNETSCALER:*” to see which data that has come from the NetScaler.
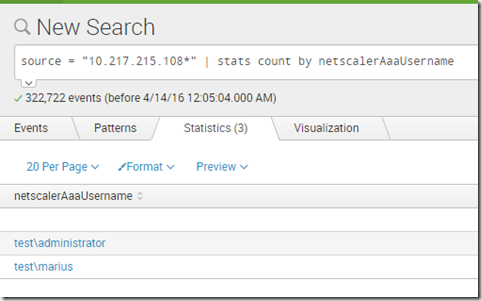
So notice there is a lot of data here since I choose the true expression in the appflow settings, but I can easily do sorting between the different settings. So let’s say I want to get all users which have accessed Citrix NetScaler Gateway?
source = “10.217.215.108*” | stats count by netscalerAaaUsername
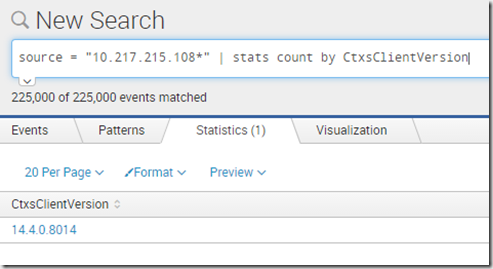
Citrix Receiver versions connecting?
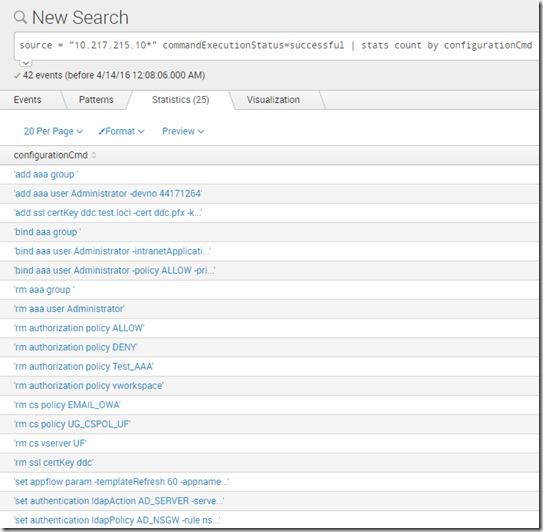
Endless possibilities with this module and being able to instant search data and it can also do syslog check as well, for instance if we made some changes to NetScaler.


Dear Marius,
great article. What do you think about using the following Splunk App for NetScaler with AppFlow
Have you ever tried it ?
Hi Christian,
Thanks! I tried an Splunk App for NetScaler but it hasn’t been updated for a while and since Appflow has changed alot of the last releases the splunk app didn’t work.